Process Analytics
Analytics reports how a deployed process behaved across many instances: where time goes, which branches instances took, where they failed, and how those figures differ between groups of instances.
Open Analytics from the BPMN navigation. The section is present when the deployment configures a read rate, see Configuration.
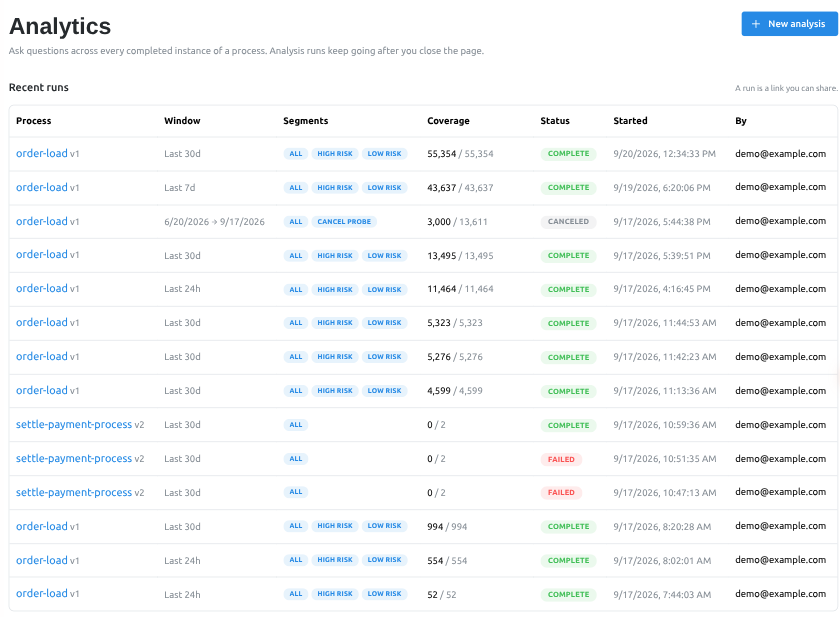
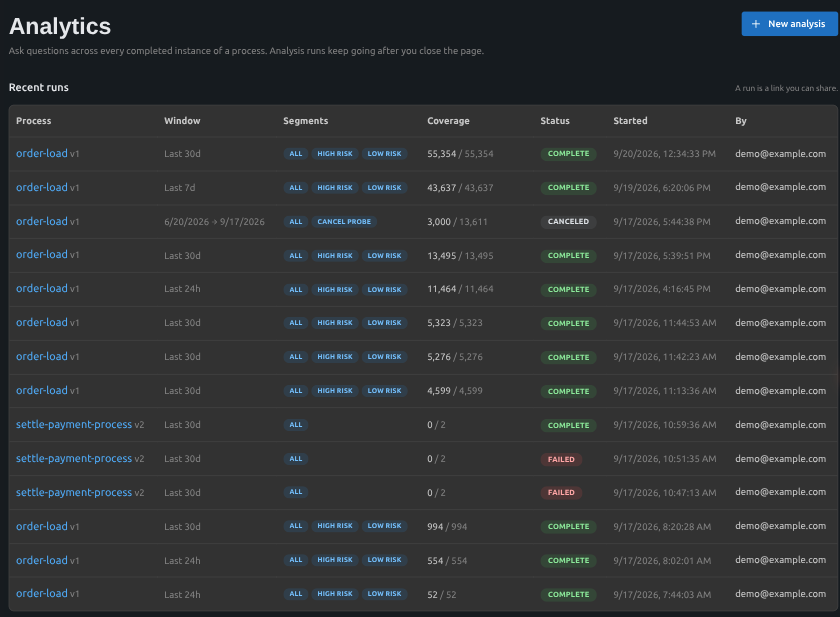
Two sources of figures
| Source | Covers | Availability |
|---|---|---|
| Overview | Instance counts, throughput, incidents | On first paint, complete |
| Deep analysis | Node durations, branches, routes, instance durations, rotations | Needs an analysis run, converges as the run reads |
Overview reads the instance and incident tables. Deep analysis reads each instance's execution history from Temporal.
Overview
The overview panel sits at the top of every run page. It opens on a 30 day window and offers 24h, 7d, 30d and 90d, independent of the run's own window.
| Card | Contents |
|---|---|
| Instances | Total in the window, with completed, failed and running beside it |
| Instances started | One bar per bucket. The bucket width follows the window, and empty buckets are drawn |
| Incidents by node | Most incidents first, each with the number still open |
| Incidents by error type | Counted across the window |
FAILED, TERMINATED and TIMED_OUT count as failed.
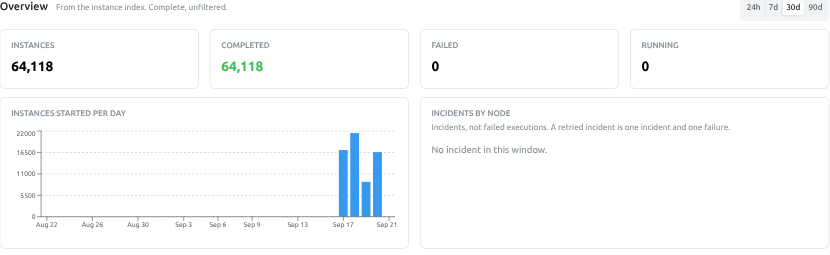
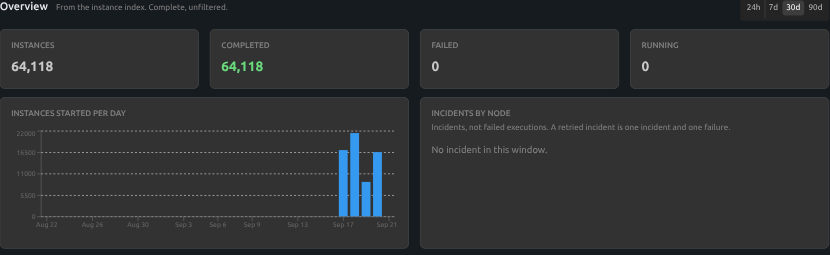
The incident cards count incidents. An incident that was retried and failed again is two incidents and two failed executions, so these figures and the Nodes table's Failed column answer different questions.
The overview is unfiltered. A segment predicate reads an instance's variables, and variables arrive with the history fetch that an analysis run performs.
Analysis runs
An analysis run is a durable object with an id and a URL. Creating one returns immediately and the read continues in the background. The run page polls it, so figures appear while the read is still going, and closing the tab, losing the connection or restarting the replica costs at most one checkpoint interval.
Starting a run
New analysis opens the drawer.
| Field | Detail |
|---|---|
| Process, Version | One deployed version. Node ids are defined by the version that declares them, so a run covers exactly one version |
| Time window | 24h, 7d, 30d, 90d, or a custom from and to |
| Segments | One to five named groups, see Segments |
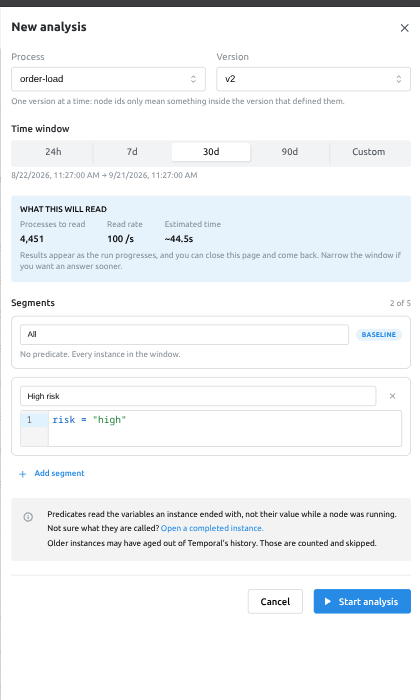
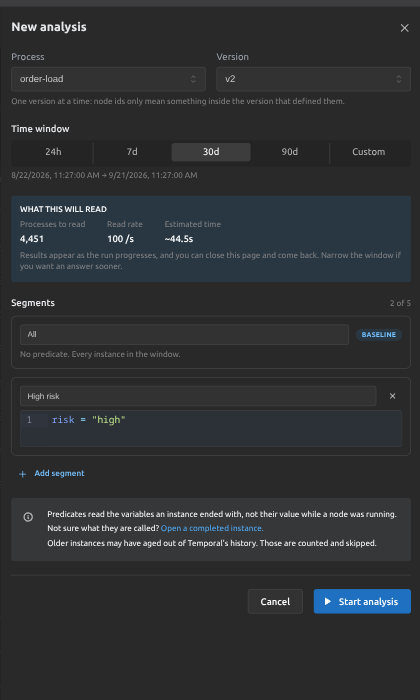
Before the run starts, the drawer reports the number of instances in the window, the configured read rate, and the estimated time from dividing one by the other.
The window is frozen when the run is created, so a resumed run enumerates exactly what it started with.
Submitting a window and segment list that already has a RUNNING or PAUSED run on the same definition opens that run.
Run status
| Status | Meaning |
|---|---|
RUNNING | Reading |
PAUSED | Stopped by an operator. Folded figures are kept and a resume continues from the checkpoint |
COMPLETE | The read reached the end of the window |
FAILED | The read stopped on an error, shown in a banner on the run page |
CANCELED | Stopped by an operator. Folded figures are kept |
A RUNNING run that no replica has picked up is marked queued and is waiting for a slot under the concurrency cap.
Controls
| Action | Effect |
|---|---|
| Pause | Stops the read at the current checkpoint |
| Resume | Continues from the checkpoint |
| Cancel run | Stops a RUNNING or PAUSED run |
| Re-analyze | Opens the drawer carrying the same segments and a window of the same length ending now |
| Export | CSV or JSON, see below |
CSV is one row per node per segment, with the coverage counters repeated on every row. JSON carries the coverage, every segment and the model element names. Both files are named <process>-v<version>-<date>, with -partial appended when the run had not finished.
Coverage
The progress card carries:
- Analyzed N of M with a percentage.
Mis counted once when the run starts. - How far back the read has reached. A run reads newest first, so a partial result describes recent behaviour.
- The window.
- Skipped, instances whose row is in the database and whose history is no longer readable.
- The read rate, the elapsed time, and the estimated time remaining.


Retention and skipped instances
A run reads each instance's history by explicit run id, taken from the run chain recorded in the database. Archived history is readable on that path: once Temporal deletes the live history it serves the archived copy for the same run id, so archival keeps instances analysable past Temporal's retention.
An instance is skipped when its history is readable from neither live persistence nor archival. Skips are found while reading, one instance at a time, and the run walks on.
Once the app level retention pass deletes the instance row, the instance is no longer enumerated at all. See History retention and archival.
Read cost
A run reads one history per Temporal run in an instance's chain. An instance that rotated through Continue-as-New three times costs three reads, and the Rotations per instance card reports that distribution.
Reads are rate limited to the configured instances per second, and a run holds that rate for its whole read. See Configuration.
Segments
A segment is a name and a FEEL boolean over the variables an instance ended with. A run carries one to five of them. The first segment is always unfiltered and is the baseline that comparison works against.
| Predicate | Result |
|---|---|
| Empty | Every instance in the window matches |
Evaluates to true | The instance joins the segment |
Evaluates to false | The instance stays out of the segment |
| Cannot be evaluated | Counted under "could not be evaluated" and left out of the segment |
A predicate that names a variable an instance does not carry cannot be evaluated against it. A variable written on one branch only produces this for every instance that took a different branch. The run page reports the count per segment, and flags a segment where no instance could be evaluated at all.
Every segment is folded during the same pass, so a run with five segments reads each instance once.
amount > 50000
customer.vip
amount > 50000 and customer.region = "EU"
Predicates read root scope variables. See Variables.
Reading the results
Counts, failures, cancellations, minimum and maximum are exact. p50, p95 and p99 come from a bucketed histogram and are within about 2%.
While a run is RUNNING, every figure covers the instances read so far.
Where the time goes
A heatmap over the deployed diagram.
| Metric | Colours each node by |
|---|---|
p50, p95, Max | The selected duration, with a log scale toggle |
Frequency | Number of executions |
Error rate | Failed executions over total executions |
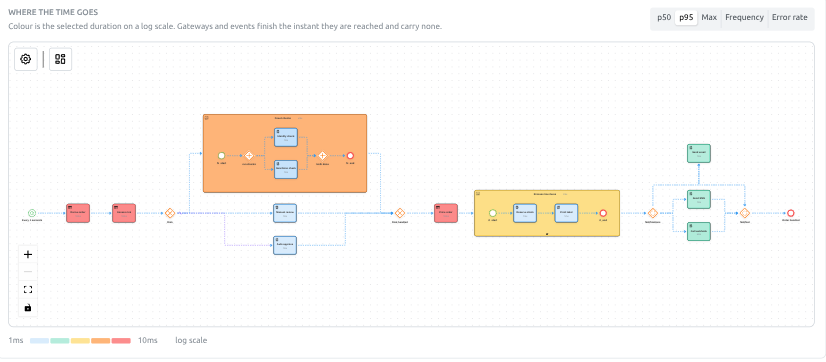
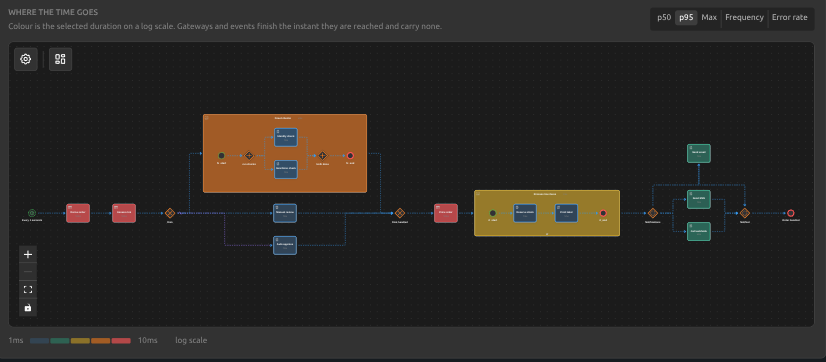
Gateways and events finish the instant they are reached and carry no duration.
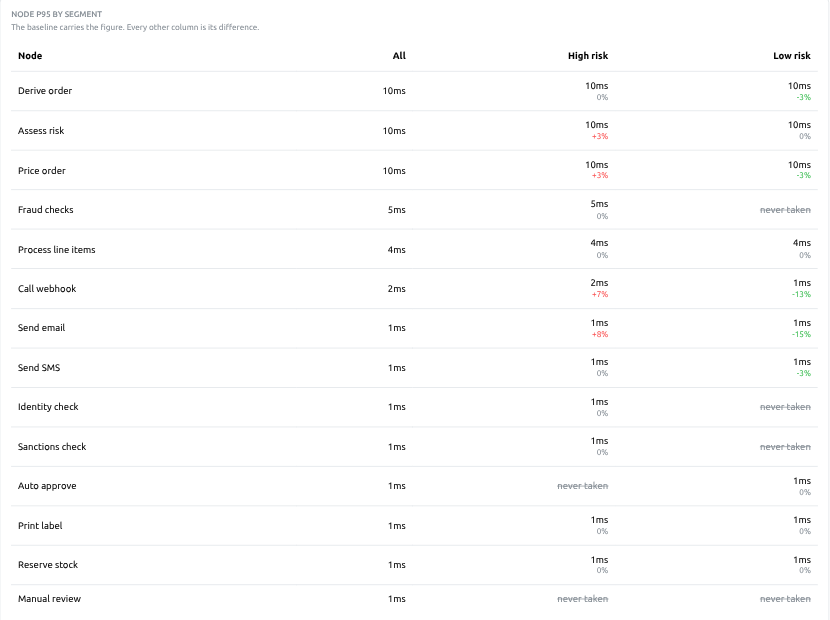
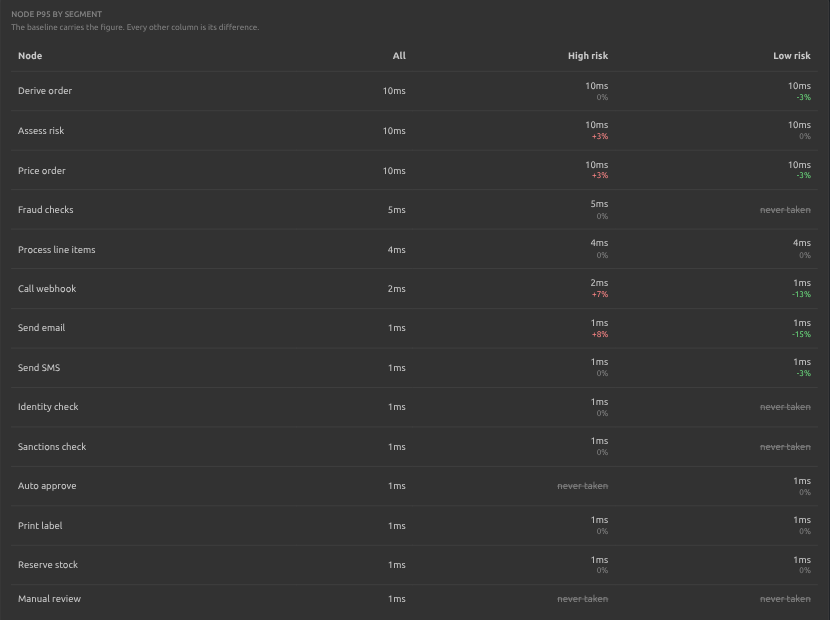
In delta mode the colour is the difference against the baseline, and a node the segment never took is struck through.
When the analysed version is no longer available the diagram is not drawn. Every figure below it is unaffected.
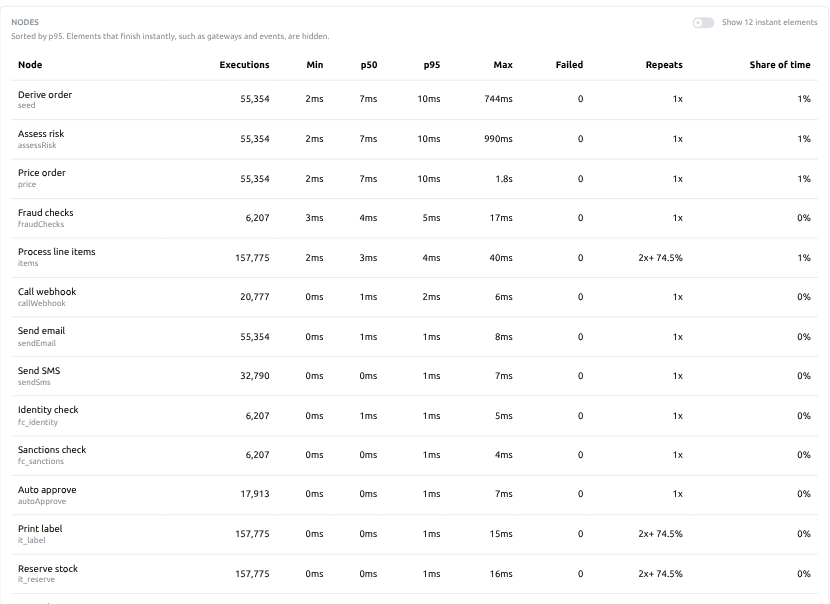
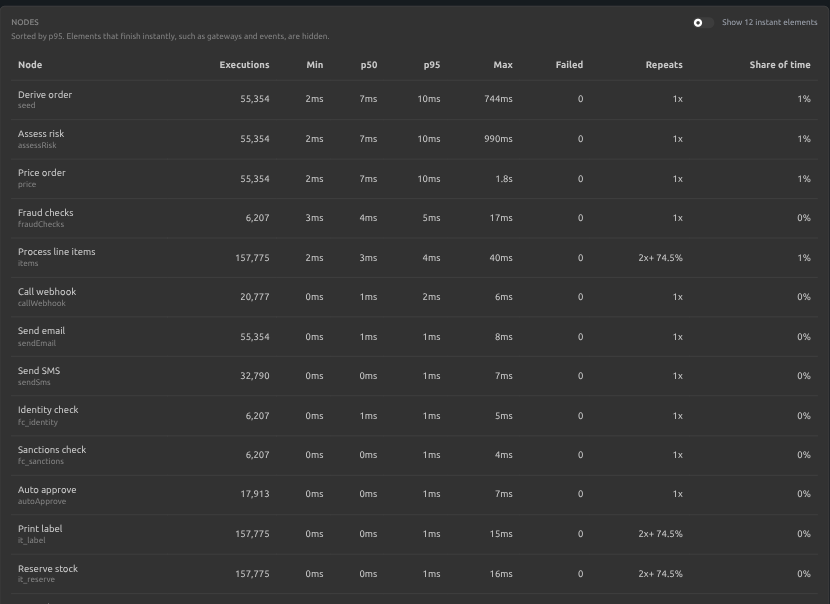
Nodes
Sorted by p95. Elements that finish instantly sit behind Show N instant elements.
| Column | Contents |
|---|---|
| Node | Element name and id |
| Executions | Times the node was entered across the segment |
| Min, p50, p95, Max | Duration |
| Failed | Executions that threw |
| Repeats | Executions per instance, bucketed as 1, 2, 3, 4+ |
| Share of time | This node's duration sum over the segment's instance duration sum |
Instance duration
A histogram over the segment's completed instances. A running instance has no end time and is not in it.
Rotations per instance
Temporal runs per instance, bucketed as 1, 2, 3, 4+. An instance appears above 1 when it outgrew a single Temporal run and rotated through Continue-as-New.
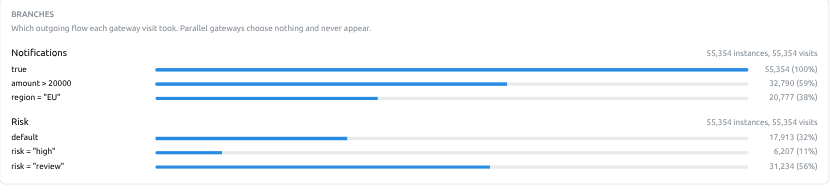
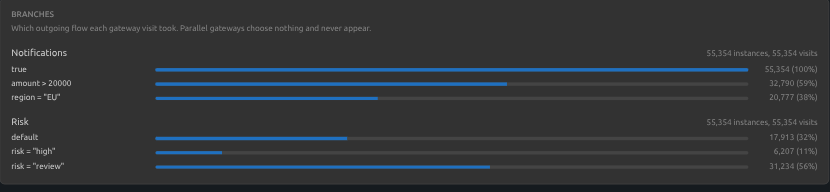
Branches
Per gateway, the instances that reached it, the number of visits, and the share per outgoing flow.
- Reached counts instances. Takings counts visits. A gateway inside a loop is visited more than once per instance.
- Parallel gateways choose nothing and do not appear.
- A visit is counted as ambiguous when two of the gateway's outgoing flows lead to the same node.
- A default flow is labelled
default. A flow drawn without a name is labelled with its condition.
Routes
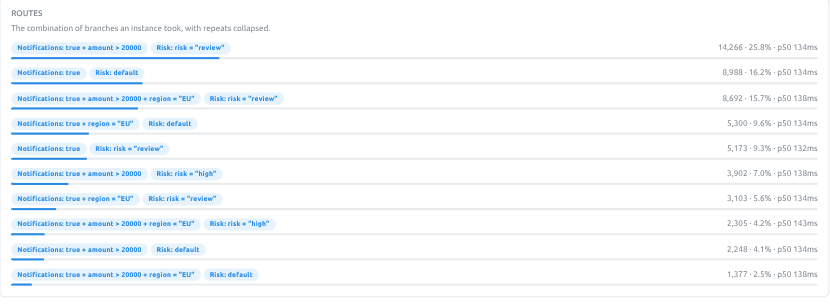
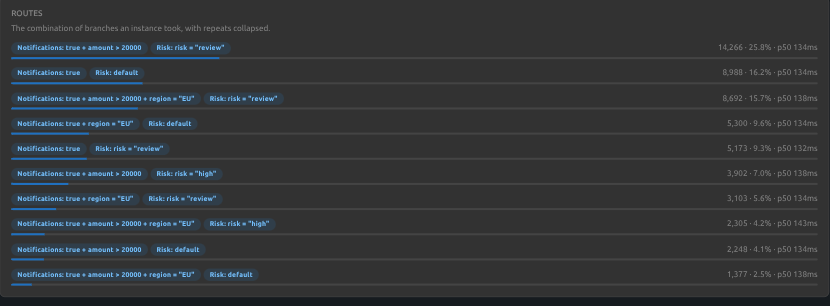
The combination of branches an instance took, with repeats collapsed into 1, 2, 3, 4+. Most travelled first, 50 at most, with the instances on further routes counted below the list.
Selecting a route strokes the flows it took on the diagram and fades the rest. Selecting it again clears it.
Comparing segments
With more than one segment the run offers three modes.
| Mode | Shows |
|---|---|
| One segment | The selected segment on its own |
| Side by side | Every segment together |
| Delta vs baseline | The selected segment as its difference from the first segment |
Two comparisons are drawn across segments:
- Node p95 by segment, where the baseline column carries the figure and every other column carries its difference.
- Branch mix, one gateway at a time, one bar per segment, each bar adding to 100% of that segment.
Configuration
| Variable | Default | Description |
|---|---|---|
ANALYTICS_READ_RATE | 100 | Instances per second a run is allowed to read. 0 turns the feature off |
ANALYTICS_CONCURRENCY | 16 | Instances fetched in parallel within one run |
ANALYTICS_MAX_CONCURRENT_RUNS | 3 | Runs executing at once per replica. Each holds its own read rate |
ANALYTICS_RETENTION_DAYS | 30 | Days a finished run is kept before the retention pass drops it |
A run's rate is read capacity that the live engine does not get, so the rate belongs below what the Temporal cluster can serve alongside process execution.
With ANALYTICS_READ_RATE=0 the Analytics section is absent from the navigation and the API refuses to create a run.
Permissions
| Action | Role |
|---|---|
| Open a run, the overview, the estimate and the runs list | Viewer |
| Create, pause, resume and cancel a run | Editor |
API
All analytics endpoints are under /projects/{projectID}/bpmn.
| Endpoint | Purpose |
|---|---|
POST /definitions/{definitionID}/analytics/runs | Start a run |
GET /definitions/{definitionID}/analytics/runs | Runs for one definition |
GET /analytics/runs | Runs across the project, paginated |
GET /analytics/runs/{runID} | Progress and folded figures |
DELETE /analytics/runs/{runID} | Cancel |
POST /analytics/runs/{runID}/pause | Pause |
POST /analytics/runs/{runID}/resume | Resume |
GET /definitions/{definitionID}/analytics/instant | Overview figures for a window |
GET /definitions/{definitionID}/analytics/estimate | Instances and time a run over a window would cost |
To find individual instances by what their variables hold, see Finding instances by variable.